


Course Description
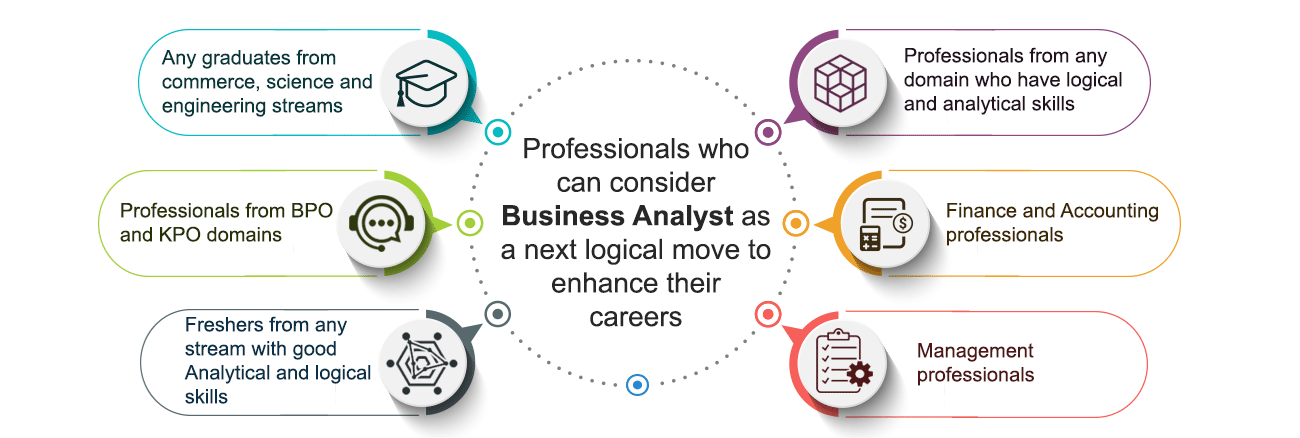
Why Business Analyst Course With ExcelR ?
Companies across the globe have taken the approach of analysing tons of data that they generate as a part of their business. The analysis helps these companies obtain valuable insights that take the profitability to great heights.
Being one of the pioneers of upskilling learners in the Data Analytics field, ExcelR has come up with a curriculum that matches the market requirement with great precision. Alongside the curriculum, ExcelR is known for its hallmark service.
There is a dedicated assignments team, that helps students solve their queries.
Advanced Certification Program in Business Analytics for Digital Transformation from IITM Pravartak:
ExcelR, in association with IIT Madras, brings to you an add-on certification for your Business Analyst Course.
This certification program provides you with:
- 15+ Hours of Interactive Live-Virtual Sessions by professors of IIT Madras.
- Optional 2-day Campus Immersion in the beautiful, state-of-the-art IIT Madras.
- A prestigious IIT Madras Pravartak Certificate.
What is the certification process?
During the period of your course, interactive live-virtual sessions will be conducted by professors of IIT Madras. An optional campus immersion will also be planned, whereby a slot will be created, and you will travel to Chennai for a two-day experience at the IIT Madras campus. Post training, you will take a short quiz on the topics discussed in the session, which will unlock your Advanced Certification Program in Business Analytics for Digital Transformation from IITM Pravartak.
Program Highlights

Top-Notch Faculty
Trainers at ExcelR are passionate about training, and carry 12+ years of industry experience.

Exhaustive Course Curriculum
Our industry-relevant course curriculum is tailored to provide practical exposure with the theory.

Real-life Projects and Bootcamps
Learners will work on real-life data analytics scenarios from various domains to get application knowledge.

Job Readiness
Intensive interview preparation from Day 1 to prepare candidates for interviews with our network of 2000+ hiring partners.
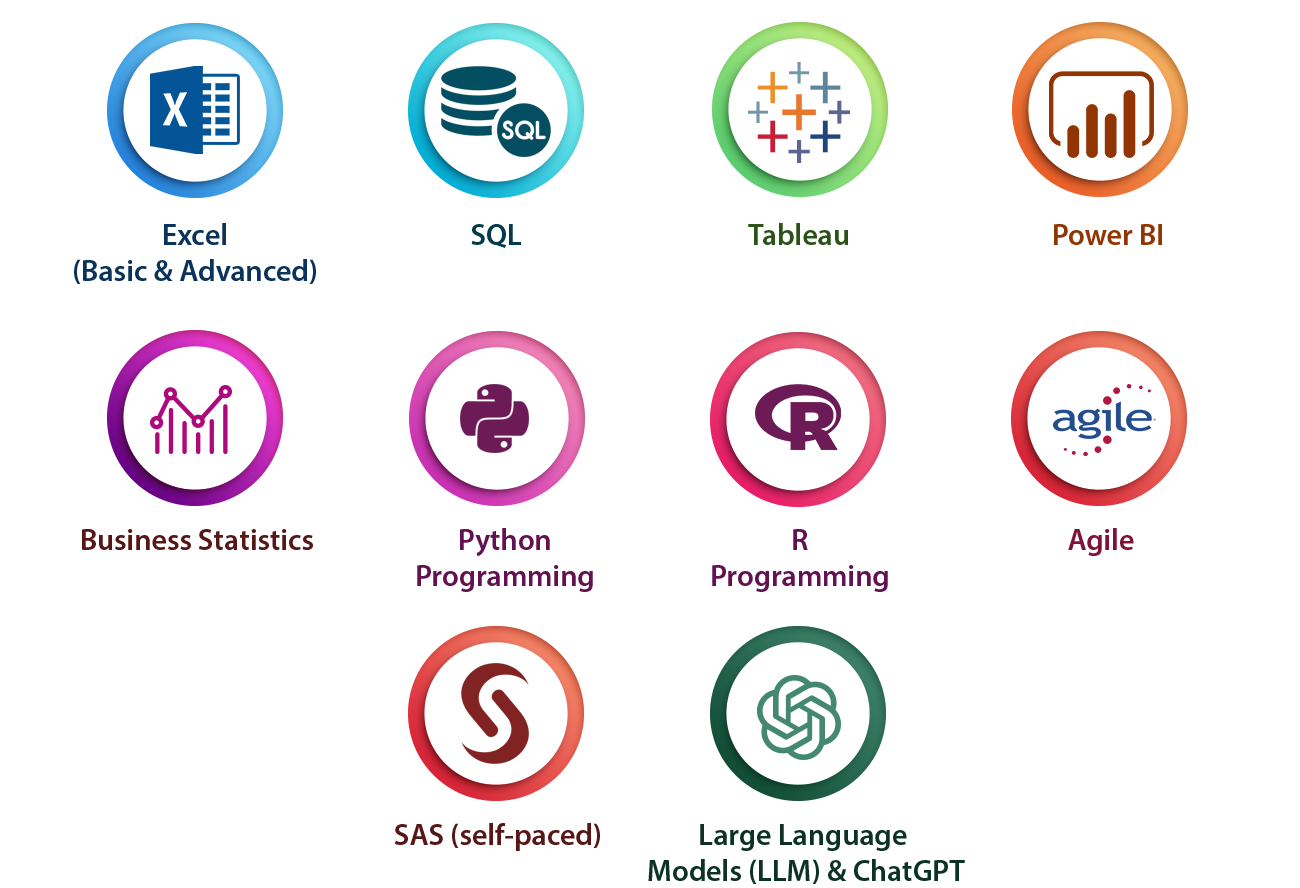
Skills Covered
Tools and Technologies
Business Analyst Project Life Cycle
- After carefully evaluating the business case in a particular domain, data will be collected surrounding it.
- Using SQL, a database will be created to store the data collected in the previous step.
- Establish a connection between the database and Tableau/Python/R tools to extract the required data. Generate user-friendly reports according to the business needs and develop the dashboard using Tableau/Power BI.
Projects
- This project requires learners to analyze the patient data of those suffering from different diseases across various summaries. The facility, chain organizations, and dialysis stations analysis is required to be carried out where the patients are undergoing dialysis. The project also focuses on the payment mode aspect wherein if any discounts or reduction in payments have happened then those are analyzed.
- In this project, learners analyze the loan given by a financial institution to different customers of varied grades and sub-grade levels. The analysis needs to consider the loan disbursement reasons, funded amount, and revolving balance values for every customer in different states and geolocations. The project requires the customers payment modes and the last payment values.
- This HR-related project considers the attrition rate of employees working at an organization at different levels. The attrition rate analysis is done with respect to different factors such as monthly income, last promotion year, job role, and work-life balance of every employee of different departments.
- The project requires learners to analyze the usage of different fuels in different facilities in different applications by finding the MMBTu and GWHt values. The fuels used for different geo-locations and for different primary titles are also taken into consideration while doing analysis.
- The primary aim of the project is to determine the different reasons behind the delay of flights of various airlines. The analysis needs to consider the number of flights in operation, the number of flights cancelled, and the statistical summary of week-wise, state-wise, and city-wise flight distributions.
- The market for a certain product is analyzed by considering a particular retail outlet which sells these products. The project involves statistical analysis on the payment distribution from different customers with the different modes of transactions across different product categories. The feedback from customers with respect to shipping days and other factors also needs to be considered while carrying out the analysis.
Learning Path

Why ExcelR

Industry-Based Course Curriculum

Value Adds: Python Programming, Fundamentals of R, Business Statistics,Agile, SAS and ChatGPT

Work Hands-on With 50+ Labs, 30+ Assignments, and 1500+ Interview Preparation Questions

Dedicated Placement Cell

Support through WhatsApp, Calls, & Emails

Lifetime eLearning Access
Course Curriculum
- Excel: Basics to Advanced
- MySQL
- Tableau
- Power BI
- Introduction
- MS office Versions(similarities and differences)
- Interface(latest available version)
- Row and Columns
- Keyboard shortcuts for easy navigation
- Data Entry(Fill series)
- Find and Select
- Clear Options
- Ctrl+Enter
- Formatting options(Font,Alignment,Clipboard(copy, paste special))
- Referencing, Named ranges,Uses,Arithemetic Functions
- Mathematical calculations with Cell referencing(Absolute,Relative,Mixed)
- Functions with Name Range
- Arithmetic functions(SUM,SUMIF,SUMIFS,COUNT,COUNTA,COUNTIFS,AVERAGE,AVERAGEIFS,MAX,MAXIFS,MIN,MINIFS)
- Logical functions
- Logical functions:IF,AND,OR,NESTED IFS,NOT,IFERROR
- Usage of Mathematical and Logical functions nested together
- Referring data from different tables: Various types of Lookup, Nested IF
- LOOKUP
- VLOOKUP
- NESTED VLOOKUP
- HLOOKUP
- INDEX
- INDEX WITH MATCH FUNCTION
- INDIRECT
- OFFSET
- Advanced functions
- Combination of Arithmatic
- Logical
- Lookup functions
- Data Validation(with Dependent drop down)
- Date and Text Functions
- Date Functions:DATE,DAY,MONTH,YEAR,YEARFRAC,DATEDIFF,EOMONTH
- Text Functions:TEXT,UPPER,LOWER,PROPER,LEFT,RIGHT,SEARCH,FIND,MID,TTC, Flash Fill
- Data Handling::Data cleaning, Data type identification, Remove Duplicates, Formatting and Filtering
- Number Formatting(with shortcuts)
- CTRL+T(Converting into an Excel Table)
- Formatting Table
- Remove Duplicate
- SORT
- Advanced Sort
- FILTER
- Advanced Filter
- Data Visualization: Conditional Formatting, Charts
- Conditional formatting(icon sets/Highlighted colour sets/Data bars/custom formatting)
- Charts:Bar,Column,Lines,Scatter,Combo,Gantt,Waterfall,pie
- Data Summarization: Pivot Report and Charts
- Pivot Reports:Insert,Interface,Crosstable Reports;Filter,Pivot Charts,
- Slicers:Add,Connect to multiple reports and charts
- Calculated field, Calculated item
- Data Summarization: Dashboard Creation, Tips and Tricks
- Dashboard:Types,Getting reports and charts together, Use of Slicers.
- Design and placement: Formatting of Tables,Charts,Sheets,Proper use of Colours and Shapes
- Connecting to Data: Power Query, Pivot, Power Pivot within Excel
- Power Query: Interface, Tabs
- Connecting to data from other excel files, text files, other sources
- Data Cleaning
- Transforming
- Loading Data into Excel Query
- Connecting to Data: Power Query, Pivot, Power Pivot within Excel
- Using Loaded queries
- Merge and Append
- Insert Power Pivot
- Similarities and Differences in Pivot and Power Pivot reporting
- Getting data from databases, workbooks, webpages
- VBA and Macros
- View Tab
- Add Developer Tab
- Record Macro:Name,Storage
- Record Macro to Format table(Absolute Ref)
- Format table of any size(Relative ref)
- Play macro by button
- shape
- as command(in new tab)
- Editing Macros
- VBA:Introduction to the basics of working with VBA for Excel: Subs, Ranges, Sheets
- Comparing values and conditions
- if statements and select cases
- Repeat processes with For loops and Do While or Do Until Loops
- Communicate with the end-user with message boxes and take user input with input boxes, User Form
- Introduction to Mysql
- Introduction to Databases
- Introduction to RDBMS
- Explain RDBMS through normalization
- Different types of RDBMS
- Software Installation(MySQL Workbench)
- SQL Commands and Data Types
- Types of SQL Commands (DDL,DML,DQL,DCL,TCL) and their applications
- Data Types in SQL (Numeric, Char, Datetime)
- DQL & Operators
- SELECT
- LIMIT
- DISTINCT
- WHERE AND
- OR
- IN
- NOT IN
- BETWEEN
- EXIST
- ISNULL
- IS NOT NULL
- Wild Cards
- ORDER BY
- Case When Then and Handling NULL Values
- Usage of Case When then to solve logical problems and handling NULL Values (IFNULL, COALESCE)
- Group Operations & Aggregate Functions
- Group By
- Having Clause
- COUNT
- SUM
- AVG
- MIN
- MAX
- COUNT String Functions
- Date & Time Function
- Constraints
- NOT NULL
- UNIQUE
- CHECK
- DEFAULT
- Primary key
- Foreign Key (Both at column level and table level)
- Joins
- Inner
- Left
- Right
- Cross
- Self Joins
- Full outer join
- DDL
- Create
- Drop
- Alter
- Rename
- Truncate
- Modify
- Comment
- DML & TCL Commands
- DML
- Insert
- Update & Delete
- TCL
- Commit
- Rollback
- Savepoint
- Data Partitioning
- DML
- Indexes and Views
- Indexes (Different Type of Indexes)
- Views in SQL
- Stored Procedures
- Procedure with IN Parameter
- Procedure with OUT parameter
- Procedure with INOUT parameter
- Function, Constructs
- User Define Function
- Window Functions
- Rank
- Dense Rank
- Lead
- Lag
- Row_number
- Union, Intersect, Sub-query
- Union, Union all
- Intersect
- Sub Queries, Multiple Query
- Exception Handling
- Handling Exceptions in a query
- CONTINUE Handler
- EXIT handler
- Triggers
- Triggers - Before | After DML Statement
- Introduction to Tableau
- What is Tableau ?
- What is Data Visulaization ?
- Tableau Products
- Tableau Desktop Variations
- Tableau File Extensions
- Data Types, Dimensions, Measures, Aggregation concept
- Tableau Desktop Installation
- Data Source Overview
- Live Vs Extract
- Basic Charts & Formatting
- Overview of worksheet sections
- Shelves
- Bar Chart, Stacked Bar Chart
- Discrete & Continuous Line Charts
- Symbol Map & Filled Map
- Text Table, Highlight Table
- Formatting: Remove grid lines, hiding the axes, conversion of numbers to thousands, millions, Shading, Row divider, Column divider
- Marks Card
- Filters
- What are Filters ?
- Types of Filters
- Extract, Data Source, Context, Dimension, Measure, Quick Filters
- Order of operation of filters
- Cascading
- Apply to Worksheets
- Calculations
- Need for calculations
- Types: Basic, LOD's, Table
- Examples of Basic Calculations: Aggregate functions, Logical functions, String functions, Tablea calculation functions, numerical functions, Date functions
- LOD's: Examples
- Table Calculations: Examples
- Data Combining Techniques
- What is Data Combining Techniques ?
- Types
- Joins, Relationships, Blending & Union
- Custom Charts
- Dual Axis
- Combined Axis
- Donut Chart
- Lollipop Chart
- KPI Cards (Simple)
- KPI Cards (With Shape)
- Groups, Bins, Hierarchies, Sets, Parameters
- What are Groups ? Purpose
- What are Bins ? Purpose
- What are Hierarchies ? Purpose
- What are Sets ? Purpose
- What are Parameters ? Purpose and examples
- Analytics & Dashboard
- Reference Lines
- Trend Line
- Overview of Dashboard: Tiled Vs Floating
- All Objects overview, Layout overview
- Dashboard creation with formatting
- Dashboard Actions & Tableau Public
- Actions: Filter, Highlight, URL, Sheet, Parameter, Set
- How to save the workbook to Tableau Public website ?
- Power BI Introduction and Installation
- Understanding Power BI Background
- Installation of Power BI and check list for perfect installation
- Formatting and Setting prerequisits
- Understanding the difference between Power BI desktop & Power Query
- The Power BI user interface, including types of data sources and visualizations
- Getting familiar with the interface BI Query & Desktop
- Understanding type of Visualisation
- Loading data from multiple sources
- Data type and the type of default chart on drag drop.
- Geo location Map integration
- Sample dashboard with Animation Visual
- Finanical sample data in Power BI
- Preparing sample dashboard as get started
- Map visual Types and usages in different variation
- Understanding scatter Plot chart with Play axis and the parameters
- Power BI artificial intelligence Visual
- Understanding the use of AI in power BI
- AI analysis in power bi using chart
- Q&A chat bot and the use in real life
- Hirarchy tree
- Power BI Visualization
- Understanding Column Chart
- Understanding Line Chart
- Implementation of Conditional formating
- Implementation of Formating techniques
- Power Query Editor
- Loading data from folder
- Understanding Power Query in detail
- Promote header, Split to limiter, Add columns, append, merge queries etc
- Modelling with Power BI
- Loading multiple data from different format
- Understanding modelling (How to create relationship)
- Connection type, Data cardinality, Filter direction
- Making dashboard using new loaded data
- Power Query Editor Filter Data
- Power Query Custom Column & Conditional Column
- Manage Parameter
- Introduction to Filter and types of filter
- Trend analysis, Future forecast
- Customize the data in Power BI
- Understanding Tool tip with information
- Use and understanding of Drill Down
- Visual interaction and customisation of visual interaction
- Drill through function and usage
- Button triggers
- Bookmark and different use and implementation
- Navigation buttons
- Dax Expressions
- Introduction to DAX
- Table Dax, Calculated column, DAX measure and difference
- Eg:- Calendar, Calendar auto, Summarize, Group by etc
- Calculated Column
- Related, Lookup value, switch, Datedif,Rankx,Date functions
- Dax Measure and Quick Measure
- Remove filters, Keep filters, All, Allselected, Time Intelligence Functions,Rolling average,YoY, Running total
- Custom Visual
- Custom visual and understanding the use of custom
- Loading custom visual, Pinning visual
- Loading to template for future use
- Publishinhg Power Bi
- Power BI Service
- Introduction to app.powerbi.com
- Schedule refresh
- Data flow and use power bi from online
- Download data as live in power point and more
Value Added Courses
- Business Statistics
- Fundamentals of R
- Fundamentals of Python
- SAS(Self Paced)
- Agile
- ChatGPT
- Descriptive Statistics
- Data Types, Measure Of central tendency, Measures of Dispersion
- Graphical Techniques, Skewness & Kurtosis, Box Plot
- Probability and Normal Distribution
- Random Variable, Probability, Probility Distribution, Normal Distribution, SND, Expected Value
- Inferential Statistics
- Sampling Funnel, Sampling Variation, Central Limit Theorem, Confidence interval
- Introduction to Hypothesis Testing
- Hypothesis Testing (2 proportion test, 2 t sample t test)
- Anova and Chisquare
- Data cleaning and Insights
- Data Cleaning(Invalid cells,Blanks,Outliers,Null values)
- Imputation Techniques(Mean and Median)
- Scatter Diagram
- Correlation Analysis
- "Introduction to R,Installation of Rstudio,Data Types in R
- Data types(Numeric,Char,Logical,Complex,Vector,List,Matrix,Factor,Array,Dataframe),Relational operators,Logical operators
- Decision making statements,Loops,Functions
- If,Ifelse,For loop,While loop,Repeat,Functions
- Built in Functions in R,Joins,dplyr and ggplot2
- Merging dataframes,Analyzing Iris Dataset using apply functions,dplyr package(Filter,Sel,Arrange),Data visualization using ggplot2,Scatterplot,Histogram,Boxplot
- Anaconda Installation,Introduction to python,Data types,Opearators
- Variables,data types(integer,Boolean,Float,List,tuple,string),Opearators in python
- Data types Contd,Slicing the data,Inbuilt functions in python
- Dictionaries,Sequence methods,Concatenate,Repetition,len,min,max functions,Index position,Addition and deletion of elements,Reverse,Sorting
- Sets,Set Theory,Regular Expressions,Decision making statements
- Sets,re module(findall,search,split,match),if,elifGetting input from user,Identity Operators
- Loops,Functions,Lambda functions,Modules
- For,While loops,Functions,Lambda functions,Math module,Calender module,Date & time module
- Pandas,Numpy,Matplotlib,Seaborn
- Data frame creation using different methods,Using Pandas anlysis on Universities,Salary data sets,Visualization using Matplotlib and Seaborn,Numpy introduction
- Introduction to Agile
- Project Definition
- Difference Between Traditional & Agile Project Mgmt.
- Agile Manifesto and Principles
- Agile Methodology
- Agile Principles
- Agile Frameworks and Terminology
- Agile Methodologies
- Scrum
- XP
- Agile Analysis and Design
- Product Roadmap
- Product Backlog
- Story Maps
- Agile Modeling
- Wireframes
- Charting
- Personas
- Planning and Monitoring
- Iteration and Release Planning
- Progressive Elaboration
- Time Boxing
- Cumulative Flow Diagram
- Kanban Boards
- WIP Limits
- Burn Charts
- Retrospectives
- Innovation Games
- Agile Metrics and Estimations
- Relative Sizing
- Story Points
- Wideband Delphi Technique
- Planning Poker
- Affinity Diagram
- Ideal time
- Velocity
- Cycle Time
- EVM
- Escaped Defects
- Quality
- Frequent Verification and Validation
- Test Driven Development
- Definition of Done
- Continues Integration
- Feedback Techniques
- Incremental Delivery
- Continuous Improvement
- Value Based Prioritization
- Customer Valued Prioritization
- Compliance
- Relative Prioritization
- Value Stream Mapping
- Minimum Marketable Feature
- Risk Management
- Risk Adjusted backlog
- Risk Burn down charts
- Risk based spike
- Agile Communications
- Team Space
- Information Radiator
- Agile Tooling
- Daily Stand-ups
- Osmotic Communication
Introduction to ChatGPT and AI
- What is ChatGPT?
- The history of ChatGPT
- Applications of ChatGPT
- ChatGPT vs other chatbot platforms
- Industries using ChatGPT
- The benefits and limitations of ChatGPT
- Future developments in ChatGPT technology
- Ethical considerations related to ChatGPT and AI
Types of AI and Chatgpt architecture
- What is AI?
- Types of AI
- What is Machine Learning?
- Neural Networks
- Deep Learning
- Natural Language Processing (NLP)
- Computer Vision
- Robotics and AI
ChatGPT Functionalities and Applications
- How does ChatGPT work?
- ChatGPT Functionalities
- Drafting emails and professional communication
- Automating content creation
- Resume and Cover letter creation
- Research and information gathering
- Brainstorming ideas and creative problem solving
- Best Practices for Using ChatGPT
ChatGPT Prompt Engineering
- What is Prompt Engineering?
- Types of Prompts
- Crafting Effective Prompts
- Using ChatGPT to generate prompt
Contact Our Team of Experts