Course Description

Assignments & Case Studies
Real-life PowerBI Project

Job Readiness Program

Lifetime access to LMS
Skills Covered

Data Preparation

Charts
DAX

Dashboard

Story Telling
Why ExcelR

Industry-Based Course Curriculum

Seven Value Added Courses

Work Hands-on with 100+ Hours of Internship and 10+ Bootcamps

Guaranteed Job Interview Calls with our 2000+ partner companies

Support through WhatsApp, Calls, & Emails

Lifetime eLearning Access
Projects
- Build a dashboard which demonstrates the patients summary under dialysis, hospital summary with rating and performance scores, filtered with respect to the chain organizations and hospitals over the period of time.as GitHub or with your own custom plugin. With AWS CodePipeline, you only pay for what you use. There are no upfront fees or long-term commitment
- Build a dashboard which represents the loan amount status of the employees working under different sectors with a drill down approach to see the employee details across various regions and payment schedules.
- Narrate a story using a dashboard that demystifies the employees' attrition rate working under the varied companies under different roles and departments with more details such as promotion, salary, job satisfaction etc.
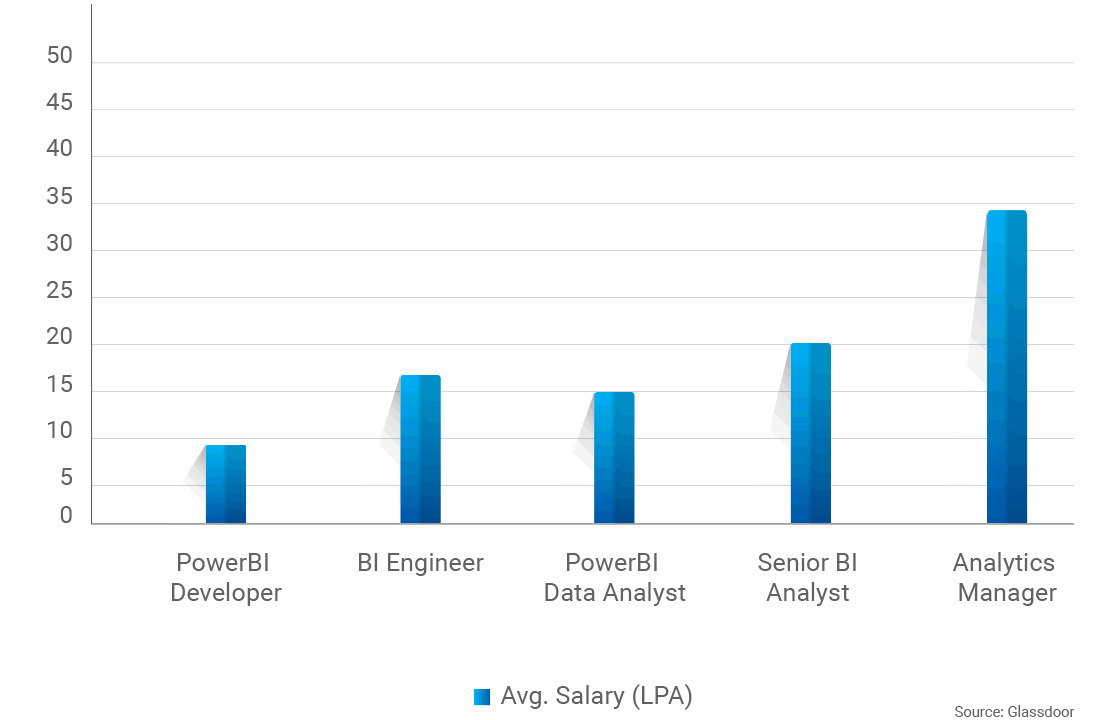
Salary Comparison Data
Course Curriculum
- Introduction to Power BI Desktop
- Getting data (Excel and RDBMS, Web, SharePoint)
- Naming for Q&A
- Direct Query vs Import data
- Introduction to Modelling
- Set up and Manager relationships
- Cardinality and cross filtering
- Creating hierarchy in the model
- Default summarization and sort by
- Creating calculated columns
- Creating measures and quick measures
- Creating visuals
- Colour and conditional formatting
- Setting sort order
- Scatter and bubble charts and play axis
- Tool tips
- Slicers, timeline Slicers and sync Slicers
- cross filtering and highlighting
- Visual, Page and Report level filters
- Drill down/up
- Hierarchies
- Constant Lines
- Tables, Matrix and Table conditional formatting
- KPI’s, Cards and Gauges
- Map Visualizations
- Custom visuals
- Managing and Arranging
- Drill Through
- Custom Report themes
- Grouping and binning
- Bookmark and buttons
- Introduction to Dax (how to write Dax and basic functions in Power BI)
- Important Dax used in Power BI along with its applications.
- how to create calculated columns and measures in Power BI and difference in its application
- Scenarios with Questions on Dax & explanation
- Creating date dimension in Power BI using calendar functions and its importance
- Sharing options
- Publish from Power BI Desktop
- Publish reports to Web
- Sharing reports and Dashboards
- Workspaces
- Apps
- Printing, PDF’s and exports
- Row level Security
- Exporting data from Visualizations Refreshing Datasets
- Understanding data refresh
- Gateways
Contact Our Team of Experts


